Ohio Energy Report: February 2026
PJM Pursuing Extension of Existing Capacity Price Cap Through 2029/2030 Delivery Year
In a February 12 letter to stakeholders, the PJM Board of Managers (“PJM Board”) announced its intent to pursue an extension of the existing capacity price collar that applies to the 2026/2027 and 2027/2028 delivery years (DYs) for the next two capacity auctions. This collar capped capacity prices in the two most recent auctions at approximately $325 per megawatt-day (MW-day).
In explaining its decision, the PJM Board cited stakeholder survey feedback, input from the White House National Energy Dominance Council, and concerns raised by governors from the 13 PJM states as factors supporting an extension of the price collar for the 2028/2029 and 2029/2030 DYs. Absent an extension, PJM’s Variable Resource Requirement (VRR) demand curve would have resulted in a significantly higher cap, approximately $550 per MW-day for the 2028/2029 DY.
As a next step, PJM must file a Federal Power Act Section 205 proposal with the Federal Energy Regulatory Commission seeking approval of the price cap extension before the 2028/2029 DY auction opens in June 2026. In parallel, PJM is developing a Reliability Backstop Procurement (“backstop auction”), envisioned as a one-time, transitional auction that would establish 15-year capacity contracts for new generation resources. The intent is to pair new generation with large, new loads, particularly data centers. PJM plans to file a detailed proposal with federal regulators by May 2026.
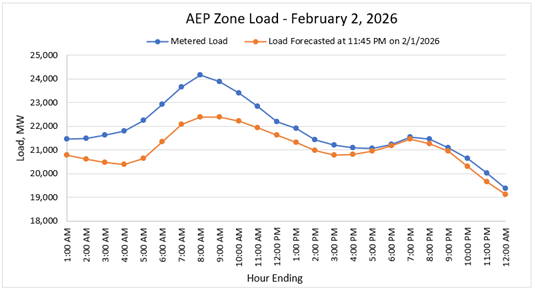
Load on February 2 Surprises to the Upside of Forecasts, Sets New AEP Zone Peak
The AEP Zone’s peak load through January 2026 was quickly and unexpectedly surpassed when load exceeded 24 gigawatts on the morning of Monday, February 2, 2026. Although PJM Interconnection’s Cold Weather Alert, Conservative Operations, Department of Energy Emergency Order, and generator restrictions remained in effect through February 2, load forecasts heading into the day were relatively modest compared to the 23,690 MW hourly load metered on January 27, 2026.
As shown in Figure 1, the gap between the final day-ahead forecast (evaluated at 11:45 PM on February 1) and actual metered load in the AEP Zone began widening during the early morning hours. At the morning peak, hour ending 8:00 AM, the metered load came in 1,779 MW higher than the prior day’s forecast.
Brakey Energy issued a coffee-fueled AEP Zone transmission coincident peak (CP) text alert shortly after 6:00 AM on February 2, followed by formal email and text notifications urging curtailment for the hour beginning at 7:00 AM.
Figure 1: Metered vs. Forecasted AEP Zone Load on February 2, 2026
With the National Oceanic and Atmospheric Administration forecasting above-normal temperatures across the AEP Zone through March, we expect severe winter weather to be behind us. As we transition into spring and the upcoming summer CP season, in our estimation it remains a coin flip whether the peak load summarized in Table 1 ultimately sets the single coincident peak (1CP) for the AEP Zone for the 12-month period ending October 31, 2026.
If the February 2 load holds as the 1CP, it would mark the fourth consecutive winter CP, potentially signaling that capacity CP management and increased distributed generation (e.g., solar) are continuing to suppress summer peak loads in the AEP Zone.
Table 1: Single Highest Load for AEP Zone through February 25, 2026

FirstEnergy’s New Base Distribution Rates Take Effect March 1
On February 24, 2025, following the Public Utilities Commission of Ohio’s (PUCO) Second Entry on Rehearing in FirstEnergy’s (FE) May 2024 base rate case, FE filed distribution rate updates with an effective date of March 1, 2026. These newly filed rates are based on the PUCO’s February 18th decision that slightly modified its November 19, 2025 Opinion and Order in the case.
These March 1 rates, which include updated capacity base distribution charges, result in a reduction of annual revenues for FE’s operating companies totaling approximately $39.4 million. This change in annual revenues stems from the PUCO’s decision to order FE to amortize approximately $245 million of previously deferred storm restoration expenses over a 25-year period, compared to the five-year period authorized by the PUCO’s initial order in the case.
The tables below summarize the current and March 1, 2026 base distribution rates for the Illuminating Company (CEI), Ohio Edison (OE), and Toledo Edison (TE) General Service Secondary (GS), General Service Primary (GP), General Service Subtransmission (GSU), and General Service Transmission (GT) customers.
Table 2. Rate Changes for FE GS Customers
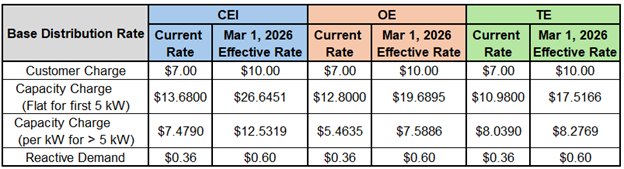
Table 3. Rate Changes for FE GP Customers
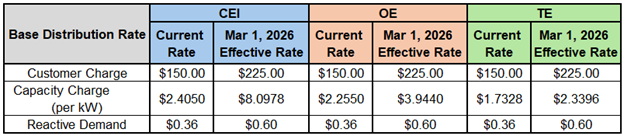
Table 4. Rate Changes for FE GSU Customers
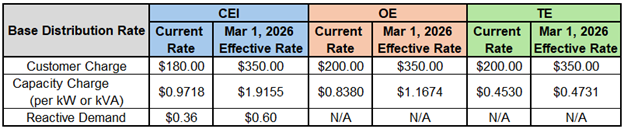
Table 5. Rate Changes for FE GT Customers
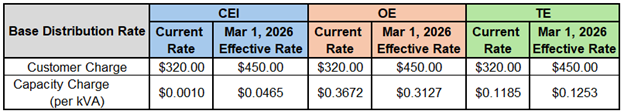
Although base distribution rates have increased across the board for all customers, these increases are coupled with rate changes to five distribution related riders, which have mostly decreased. These riders include the Tax Savings Adjustment Rider, the Distribution Uncollectible Rider, Advanced Metering Infrastructure / Modern Grid Rider, PIPP Uncollectible Rider, and Delivery Capital Recovery Rider. A new distribution rider called the Customer Credit Recovery Rider was also established in this case.
If you have questions about how these expected rate changes may affect your business, please contact Katie Emling.
Residential Corner
Sky-high Base Residual Auction (BRA) clearing prices and the not-too-distant deep freeze have resulted in historically high generation offers. We recommend customers with an approaching contract expiration migrate to a short-term nine-month offer with AEP Energy for 8.99¢/kWh.
Regarding natural gas, Brakey Energy has long found defaulting to distribution utilities’ Standard Choice Offer a prudent strategy for natural gas supply. However, this strategy can result in outlier bill outcomes – like many customers likely experienced from the recent extreme cold.
While we had previously recommended Columbus Gas of Ohio customers competitively source gas because of atypically high SCO auction clearing prices, we are comfortable again recommending the SCO because of lower clearing prices.
Natural Gas Market Update
The NYMEX price for February settled at $7.460 per Million British Thermal Units (MMBtu) on January 28, 2026. This price is up 59.2% from the January 2026 price of $4.687 per MMBtu. This settlement price is used to calculate February gas supply costs for customers that contract for a NYMEX-based index gas product.
The graph below shows the year-over-year monthly NYMEX settlement prices for 2022, 2023, 2024, 2025, and 2026 year-to-date. Prices shown are in dollars per MMBtu of natural gas.
Figure 2: NYMEX Monthly Natural Gas Settlement Prices
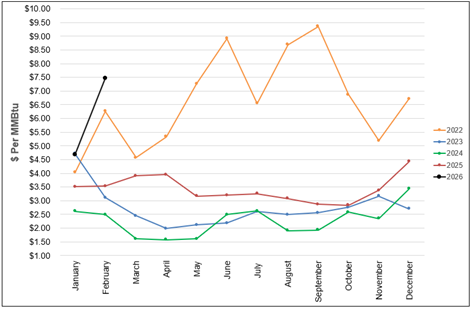
Figure 3 below shows the historical February 26, 2024 through February 26, 2026 Around the Clock (ATC) forward NYMEX natural gas prices in dollars per MMBtu for the balance of 2026 (labeled as “Custom Strip”) and calendar years 2027, 2028, 2029, and 2030.
Figure 3: ATC Calendar Year NYMEX Natural Gas Prices
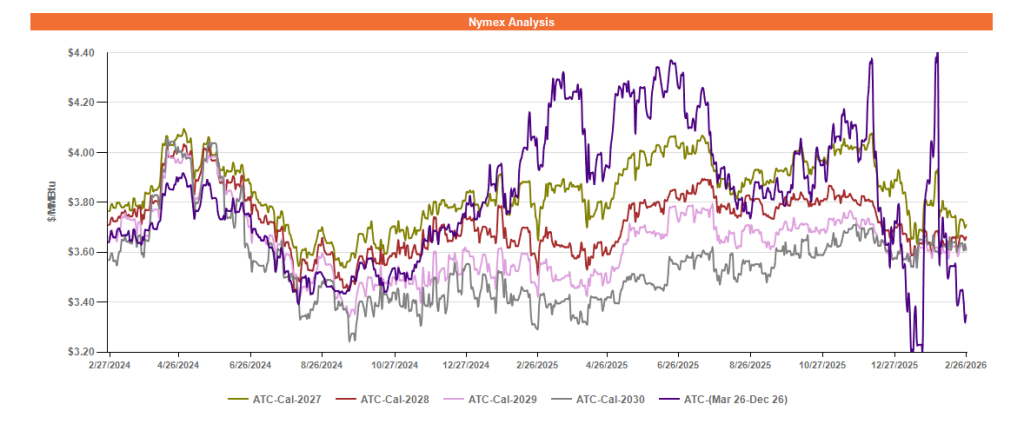
*Pricing courtesy of Direct Energy Business.
The forward gas market has seen exceptional, record-breaking volatility over the course of this winter, especially in late January and early February. Winter Storm Fern’s nationwide impact was significant, but ultimately not as severe as meteorologists had predicted. Immediately after the storm, short-to-medium term weather forecasts indicated milder weather to close out the winter, causing forward gas prices to collapse nearly as quickly as they had risen in anticipation of the storm.
Forward gas prices beyond 2026 have traded in a tighter band, reflecting the trends of robust domestic gas supply – which continues to trend near all-time highs – and market participants’ continued expectation of a global LNG supply glut potentially forming in 2027-2028.
Electricity Market Update
Figure 4 below shows the historical February 26, 2024 – February 26, 2026 ATC forward power prices in dollars per MWh for the balance of 2026 (labeled as “Custom Strip”) and calendar years 2027, 2028, 2029, and 2030 for the AD Hub.
Figure 4: ATC Calendar Year Power Prices for the AD Hub
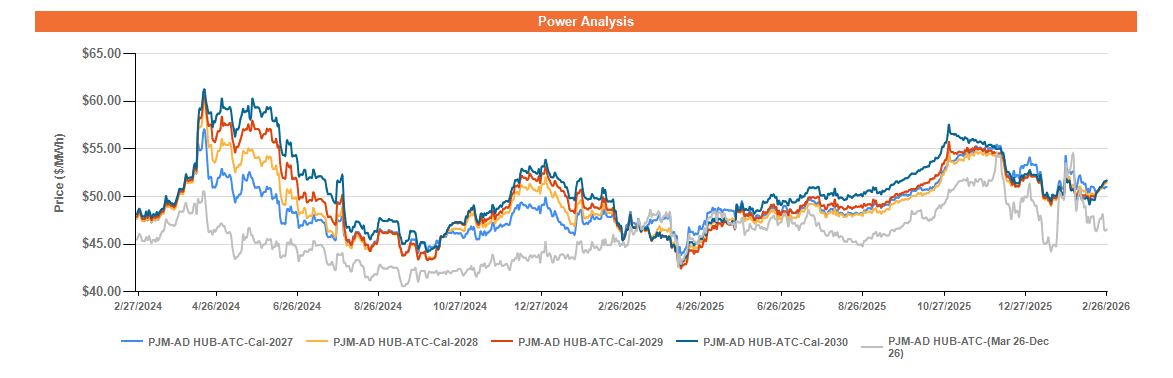
* Pricing courtesy of Direct Energy Business.
Short-term forward power prices for the balance of 2026 have followed trends in the forward gas market over the course of this winter, but the volatility has been less pronounced, comparatively. However, spot power prices on the other hand rose to extreme levels during the last week of January, peaking at over $1,000/MWh ($1/kWh). At the AD Hub, spot power prices averaged $104.61/MWh (10.461¢/kWh) in January, and $66.48/MWh (6.648¢/kWh) so far through February.
Forward power prices beyond 2026 have traded similarly to forward gas prices for the same period. Elevated capacity prices have helped to keep a lid on forward power prices, and the efforts to extend the $325/MW-day ceiling on capacity prices have helped relieve market anxieties about runaway capacity costs – at least temporarily – which has led to relative stability in forward power prices in outlier years.