Ohio Energy Report: September 2025
Peak Loads for Summer 2025
As we approach September 30 – the end of the summer coincident peak (CP) management season – weather and load forecasts indicate that the five coincident peaks for capacity and transmission in the ATSI Zone have likely been set.
PJM’s capacity peaks reached record levels this summer. The preliminary fifth-highest load (“5CP”) on the PJM grid is the highest we’ve seen since we began tracking capacity CPs in 2008. Most notably, the preliminary highest load (“1CP”) was 7.6 GW above PJM’s 2024 1CP and only 5.4 GW below PJM’s all-time peak of 165,563 MW set in 2006. On June 23, 2025, PJM’s load exceeded the summer forecast by more than 6 GW, with that margin expected to grow once demand response load is added back.
The ATSI Zone’s preliminary 5CP is the highest 5CP since 2016, and its preliminary 1CP is 147 MW above last summer’s peak, but 189 MW lower than PJM’s original forecast.
For customers with generation contracts that pass-through capacity, costs are allocated based on each customer’s share of PJM’s five regional peaks (“Capacity CPs”). Similarly, for customers in FirstEnergy’s (FE) or AEP Ohio’s (AEP) transmission pilot programs, transmission costs are tied to each customer’s share of FE’s or AEP’s zonal peaks (“Transmission CPs”). By managing load during potential CP events, customers can reduce future capacity and transmission expenses.
Brakey Energy issues email and text alerts ahead of potential Capacity and Transmission CP events for participating clients. As of September 25, 2024, we issued 14 Capacity CP alerts and 15 FE Transmission CP alerts. We also issued four AEP CP alerts during Summer 2025 and five during this past winter.
The tables below show PJM’s and FE’s five highest summer loads in 2025 and AEP’s highest load since November 1, 2024, along with the date and time of each occurrence. All data are preliminary.
Table 1: Five Highest Loads for PJM through September 22, 2025
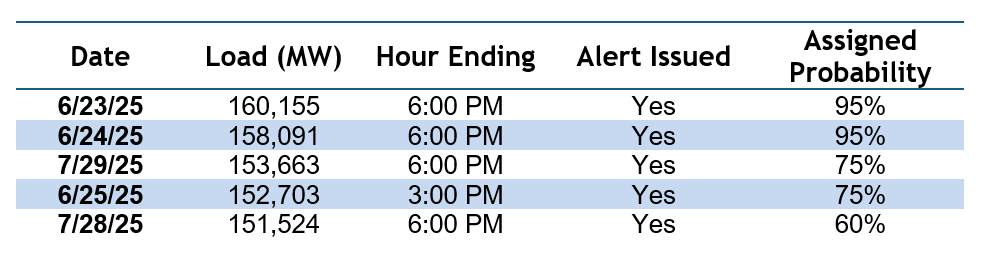
Table 2: Five Highest Loads for FE through September 22, 2025
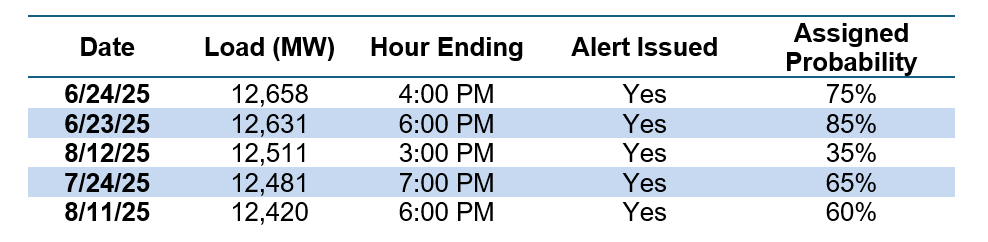
Table 3: Single Highest Load for AEP through September 22, 2025

Based on current weather forecasts, we do not anticipate any further potential CP events for this summer. Since PJM can adjust metered load data for up to 90 days, Brakey Energy will continue to monitor metered loads and will provide an update on the Capacity and Transmission CPs once they are finalized by PJM.
If you would like to know how your performance during the Capacity and/or Transmission CPs mentioned above will impact your future electric costs, please contact Katie Emling.
FirstEnergy’s SSO Rates Increasing Slightly on October 1
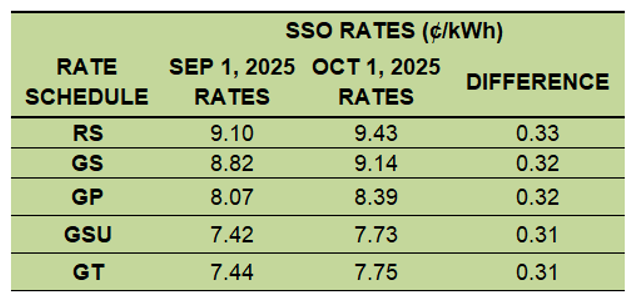
Electric costs will be increasing slightly on October 1 for Ohio Edison (OE), The Illuminating Company (CEI), and Toledo Edison (TE) customers that take electric generation service under the utilities’ Standard Service Offer (SSO). The SSO is the default rate charged by the utility for generation services to customers that do not contract with an alternative supplier. The SSO generation rate is higher during the three summer months of June, July, and August than it is during the other nine months of the year.
The current and October 1, 2025 SSO rates per kilowatt hour (kWh) for customers served under OE, CEI, and TE Residential (RS), Secondary (GS), Primary (GP), Subtransmission (GSU), and Transmission (GT) rate schedules are shown in the tables below. These rates will change again on January 1, 2026.
Table 4: OE SSO Rates
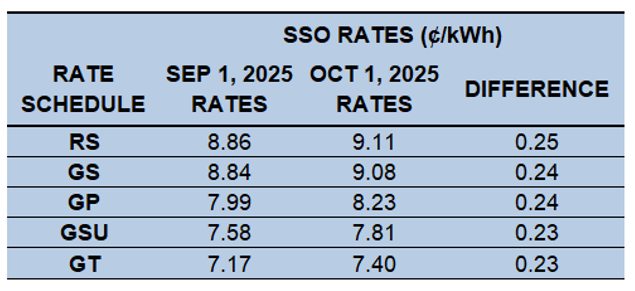
Table 5: CEI SSO Rates
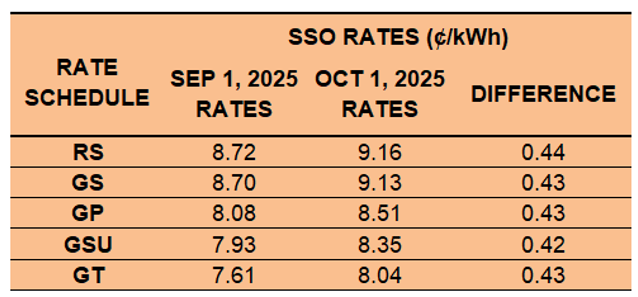
Table 6: TE SSO Rates
If you are not receiving electric generation service from an alternative supplier and would like more information about how FE’s SSO rate update will impact your monthly electric costs, please contact Katie Emling.
Residential Corner
The sky-high Base Residual Auction (BRA) clearing price has resulted in all generation offers being materially higher than what customers were once accustomed to.
While a few teaser rates remain available, the best longer term option is a 8.29¢ 12-month offer from Energy Harbor. Matt Brakey recently signed up for this very offer himself this past month.
Regarding natural gas, Brakey Energy has long and often found defaulting to distribution utilities’ SCO a prudent strategy for natural gas supply. We encourage our readers to utilize this strategy if they are comfortable riding the highly volatile natural gas market. To employ this strategy, you simply need to provide a termination notice to your existing supplier and you will automatically be defaulted to the SCO.
Natural Gas Market Update
The NYMEX price for September settled at $2.867 per Million British Thermal Units (MMBtu) on August 27, 2025. This price is down 6.9% from the August 2025 price of $3.081 per MMBtu. This settlement price is used to calculate September gas supply costs for customers that contract for a NYMEX-based index gas product.
The graph below shows the year-over-year monthly NYMEX settlement prices for 2021, 2022, 2023, 2024, and 2025 year-to-date. Prices shown are in dollars per MMBtu of natural gas.
Figure 1: NYMEX Monthly Natural Gas Settlement Prices
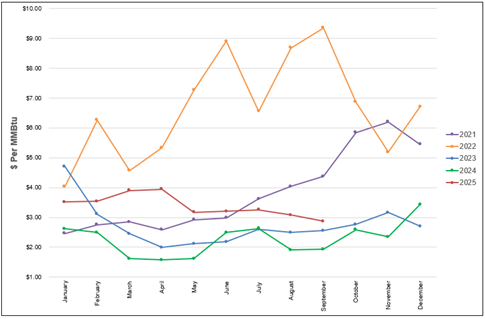
Figure 2 below shows the historical September 25, 2023 through September 25, 2025 Around the Clock (ATC) forward NYMEX natural gas prices in dollars per MMBtu for the balance of 2025 (labeled as “Custom Strip”) and calendar years 2026, 2027, 2028, 2029, and 2030.
Figure 2: ATC Calendar Year NYMEX Natural Gas Prices
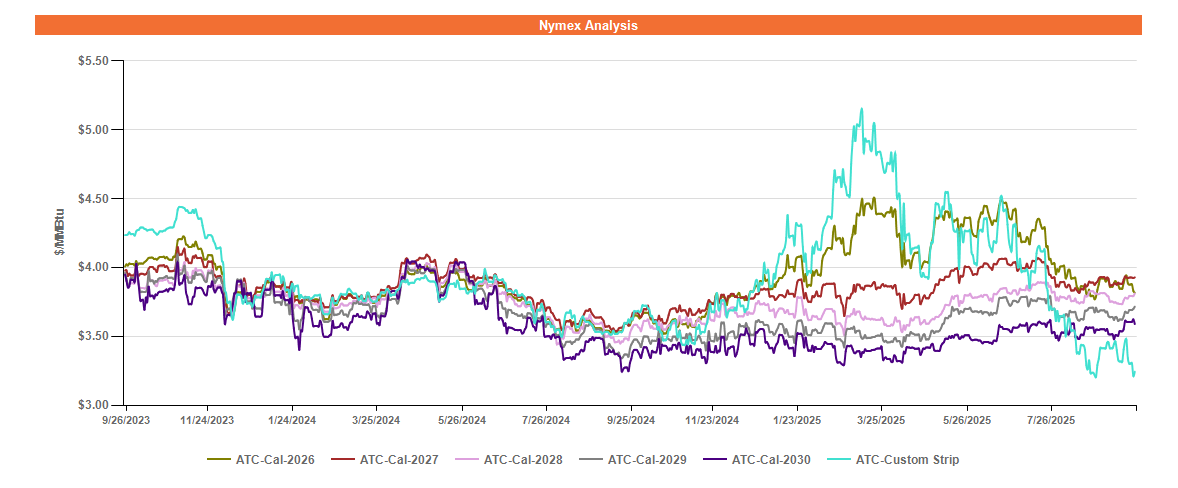
*Pricing courtesy of Direct Energy Business.
Although trading flat month-over-month, forward gas prices have softened overall since the beginning of the summer, largely due to record high production in July and August. The robust production combined with mild temperatures to close out the summer has put downward pressure on forward gas prices, particularly through May 2026. Furthermore, despite the heat in June and July, power burn demand was lower than these months in 2024, thanks to increased power generation from coal and solar.
Wholesale forward gas prices from June 2026 onward remain in a state of backwardation, where prices are softer in the long term compared to the near term, as fast-increasing global liquefied natural gas (LNG) export capacity could create a supply glut and depress domestic natural gas prices.
Electricity Market Update
Figure 3 below shows the historical September 25, 2023 through September 25, 2025 ATC forward power prices in dollars per Megawatt hour (MWh) for the balance of 2025 (labeled as “Custom Strip”) and calendar years 2026, 2027, 2028, 2029, and 2030 for the AD Hub.
Figure 3: ATC Calendar Year Power Prices for the AD Hub
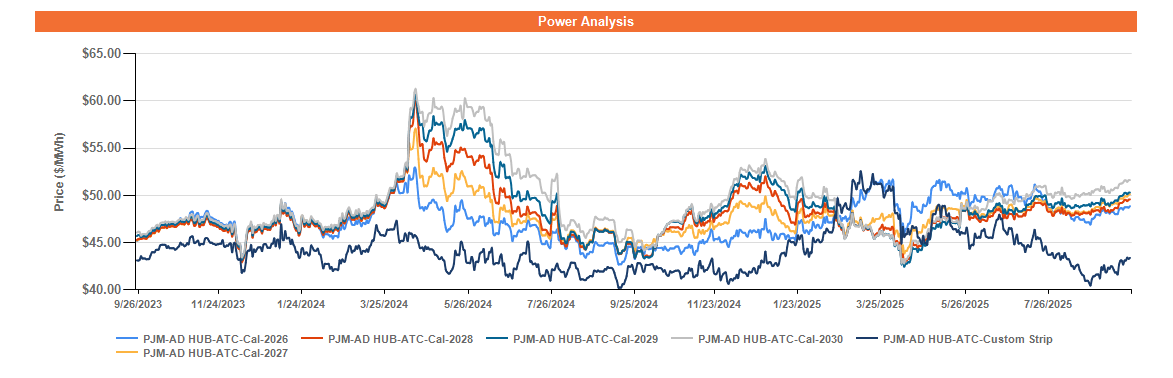
*Pricing courtesy of Direct Energy Business.
Having been in a state of backwardation since this past winter, forward power prices have recently entered a state of contango, where prices in the near term are softer than the long term.
In the near term through mid-2026, forward power prices have followed trends in the forward natural gas market, though the softness has been less pronounced. Record-high gas production in July and August combined with mild temperatures to end the summer allowed for strong gas injections into storage and marked softness in forward gas prices through May 2026.
In the longer term beyond mid-2026, forward power prices have held steady when compared to trends in the gas market for the corresponding years. The established “capacity price collar” is scheduled to expire after the 2027/2028 delivery year auction, leaving capacity prices an unknown quantity in the years thereafter. In response to this and recent comments from Pennsylvania Governor Shapiro, forward power prices from June 2028 onward have risen steadily and have formed a risk premium over calendar years 2026-2028.