Ohio Energy Report: September 2026
Peak Loads for Summer 2026
As we approach the end of the summer coincident peak (CP) management season, current weather and load forecasts suggest that the CPs that drive PJM capacity costs, and FE and AEP transmission costs for participating pilot customers, have likely been established.
PJM’s capacity peaks surpassed records set just last summer. The preliminary fifth-highest load (“5CP”) on the PJM grid is the highest 5CP that we have observed since we began tracking capacity CPs in 2008. Most notably, PJM’s preliminary highest metered load (“1CP”), which occurred on July 2, is approximately 2 GW higher than the 2025 1CP, and unrestricted load on that date (metered load adjusted upward to account for activated demand response resources) set a new PJM all-time record of approximately 168.2 GW.
The ATSI Zone also reached notable highs: the preliminary 1CP exceeded 13 GW for the first time since summer 2013, and the preliminary 5CP is the highest since the zone reached 12,790 MW in summer 2012.
For customers with generation contracts that pass through capacity costs, charges are allocated based on each customer’s contribution to PJM’s five regional peaks (“Capacity CPs”). Similarly, customers participating in FirstEnergy’s (FE) or AEP Ohio’s (AEP) transmission pilot programs have transmission costs tied to their contribution to FE’s or AEP’s zonal peaks (“Transmission CPs”). By reducing load during potential CP events, customers can lower future capacity and transmission costs.
Brakey Energy issues email and text alerts ahead of potential Capacity and Transmission CP events for participating clients. As of September 24, 2026, we have issued ten Capacity CP and ten FE Transmission CP alerts. We also issued eight AEP CP alerts during summer 2026 and seven during the preceding winter.
The tables below show PJM’s and FE’s five highest summer loads in 2026, as well as AEP’s highest loads since November 1, 2025, including the date and hour of each occurrence. All data remain preliminary.
Table 1: Five Highest Loads for PJM through September 28, 2026
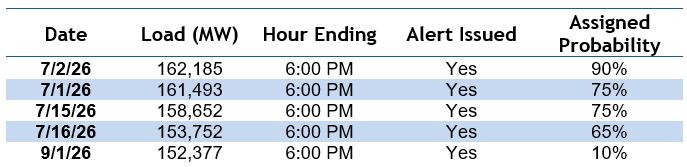
Table 2: Five Highest Loads for FE through September 28, 2026
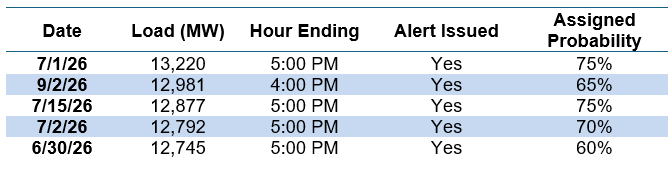
Table 3: Single Highest Load for AEP through September 28, 2026

One particularly notable result is the AEP Zone’s current peak. Metered load during the hour ending (HE) 4:00 PM on September 3 was only 70 kW higher than the second-highest peak, which occurred on September 2 during HE 6:00 PM. Given the extremely narrow margin, future data updates could potentially result in HE 6:00 PM on September 2 reclaiming the top spot as AEP’s 1CP for the year.
Based on current weather forecasts, we do not anticipate any further potential CP events for this summer. Since PJM can adjust metered load data for up to 90 days, Brakey Energy will continue to monitor metered loads and will provide an update on the Capacity and Transmission CPs once they are finalized by PJM.
If you would like to know how your performance during the Capacity and/or Transmission CPs mentioned above will impact your future electric costs, please contact Katie Emling.
PJM Demand Response Events Highlight Tightening Grid Conditions
PJM’s tightening supply-and-demand balance was on display throughout 2026, with the grid operator calling on Demand Response (DR) resources on several occasions to help maintain reliability. Ohio customers were affected by DR activations on July 2, July 3, September 1 and, most recently, September 17. While the July 2 event coincided with PJM’s new record unrestricted peak load of approximately 168,158 MW, several of the other events occurred when system demand was considerably lower.
For commercial and industrial customers participating in PJM DR programs, the 2026 events reinforce that curtailment calls should no longer be viewed solely as something that occurs during a handful of exceptionally hot summer afternoons. As electricity demand grows and PJM operates with a tighter supply cushion, generation outages, transmission constraints and unexpectedly warm weather can create stressed system conditions at substantially lower load levels, including during the traditional spring and fall “shoulder seasons.”
The September 17 event provides perhaps the clearest example of this changing dynamic. As noted in PJM’s Inside Lines, PJM forecasted peak demand of only approximately 133 GW—roughly 30 GW below the summer record—yet still called Pre-Emergency DR across most of its footprint, including Ohio.
At the time, more than 35 GW of generation was unavailable as the fall maintenance season began, certain transmission facilities were out of service, and unusually warm September weather increased load in neighboring regions, contributing to electricity exports outside PJM. Taken together, these conditions reduced PJM’s available operating cushion and prompted the grid operator to call on DR resources to increase reserves heading into the evening peak.
The September 17 event also caught many market participants by surprise, contributing to significant volatility in both spot and forward power markets. System-wide Day-Ahead prices peaked at approximately $470/MWh, while Real-Time prices exceeded $1,300/MWh, with some load zones experiencing even higher prices because of elevated congestion costs. The market reaction extended beyond the event itself, as forward power prices across the curve increased by approximately 10% following September 17.
The broader takeaway for DR participants is that they should be prepared for a wider range of operating conditions—and potentially a wider range of dates—than in years past. High system load remains an important driver of DR events, but as reserve margins tighten and the grid becomes more sensitive to generation outages, transmission limitations and regional power flows, C&I customers should increasingly expect PJM DR calls even when temperatures and overall system demand do not appear extreme.
Settlement Reached in Enbridge Gas Ohio 2025 Base Rate Case
On September 15, Enbridge Gas Ohio (Enbridge), PUCO Staff, the Ohio Energy Leadership Council, Ohio Energy Group, and several other parties filed a Stipulation and Recommendation intended to resolve Enbridge’s pending base rate case. Under the settlement, Enbridge would receive an annual base rate increase of approximately $144.6 million, compared with the Company’s original request for roughly $163.1 million. The settlement also reflects a 7.14% overall rate of return, including a 9.59% return on equity.
Commercial and industrial customers would see varying impacts depending on rate schedule and usage. Of the total increase, approximately $24.5 million would be allocated to GSS/ECTS nonresidential customers, $12.7 million to LVGSS/LVECTS customers, $9.3 million to GTS customers, and $2.2 million to DTS customers. Because the stipulated rates rely on different monthly service charges and volumetric rate blocks, actual bill impacts will vary by customer and may differ materially from the overall systemwide increase.
The settlement also includes several provisions relevant to larger C&I customers. GTS customers that fail to maintain a qualifying competitive gas supply could be moved to LVGSS or LVECTS after notice and an opportunity to cure. In addition, Enbridge would continue to evaluate negotiated contracts on a case-by-case basis, considering factors such as cost to serve, economic development benefits, and competitive circumstances.
The settlement would also provide some near-term base rate stability. Enbridge has agreed that its next base rate filing will not seek to place new base rates into effect before January 1, 2029, although riders, gas supply costs, and other bill components may continue to change. If approved by the PUCO, the revised tariffs would become effective on a bills-rendered basis within 30 days of Commission approval.
Residential Corner
Sky-high capacity prices, driven by a shrinking cushion of dispatchable generation and growing load, have kept residential rates at the highest levels in recent memory. We recommend customers with an approaching contract expiration migrate to this 8-month fixed-rate offer from Energy Harbor for 9.69¢/kWh.
Regarding natural gas, Brakey Energy has long viewed the distribution utilities’ Standard Choice Offer (SCO) as a prudent default strategy for supply. However, this approach can produce volatile bill outcomes, like the wild ride many customers experienced during the extreme cold this past winter. With natural gas settlement prices having since remained reasonable, and the commodity itself trading at compelling values relative to power, customers on the SCO are likely seeing manageable bills.
Natural Gas Market Update
The NYMEX price for September settled at $2.907 per Million British Thermal Units (MMBtu) on August 27, 2026. This price is up 6.7% from the August 2026 price of $2.725 per MMBtu. This settlement price is used to calculate September gas supply costs for customers that contract for a NYMEX-based index gas product.
The graph below shows the year-over-year monthly NYMEX settlement prices for 2022, 2023, 2024, 2025, and 2026 year to date. Prices shown are in dollars per MMBtu of natural gas.
Figure 1: NYMEX Monthly Natural Gas Settlement Prices
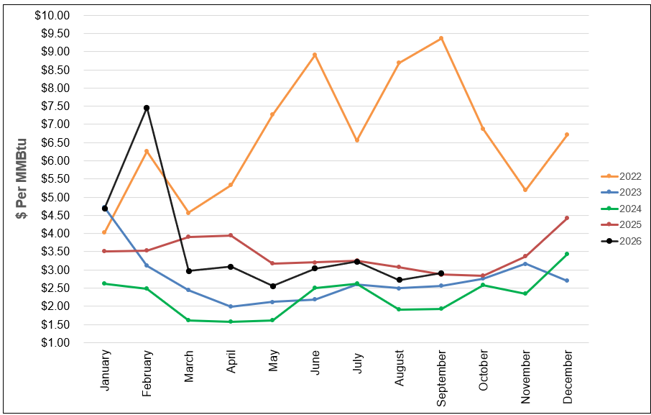
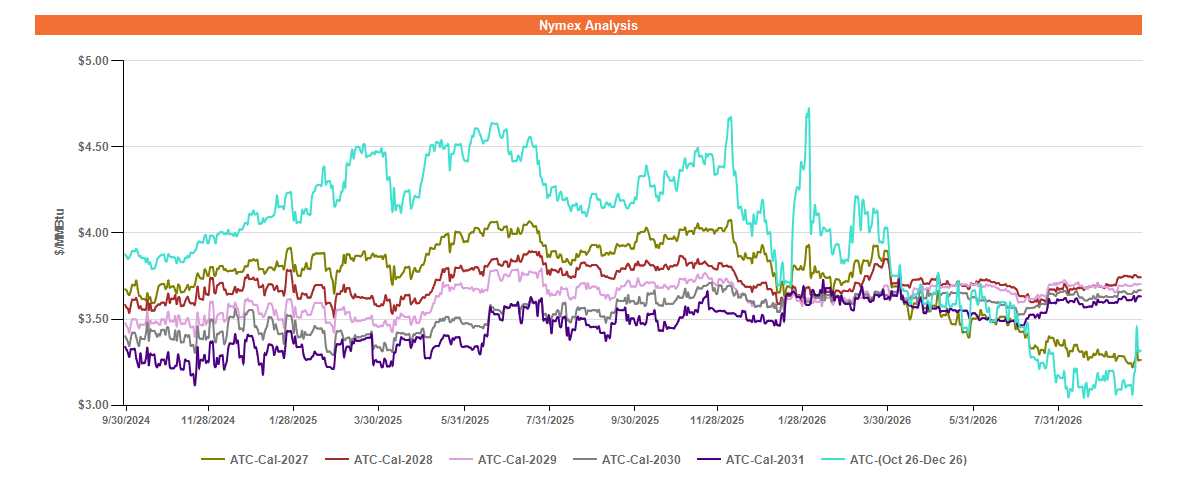
Figure 2 below shows the historical September 29, 2024 through September 29, 2026 Around the Clock (ATC) forward NYMEX natural gas prices in dollars per MMBtu for the balance of 2026 (labeled as “Custom Strip”) and calendar years 2027, 2028, 2029, 2030, and 2031.
Figure 2: ATC Calendar Year NYMEX Natural Gas Prices
*Pricing courtesy of Direct Energy Business.
Forward natural gas prices continue to trade near multi-year lows through 2027. While outer years 2028 and beyond have increased slightly over the summer, they are still trading rangebound and are soft when compared to other energy markets.
Production is robust, near all-time highs, and forecasted to increase in 2027 due to persistent LNG export demand, supported by global supply tightness as the Persian Gulf remains in conflict. Storage projections are also healthy, and early winter weather outlooks point towards an expected mild winter in the Midwest due to the impacts of a strong El Niño event. Weather outlooks and forecasts are ever-changing, and those changes could introduce volatility to the gas market as we progress into autumn.
Electricity Market Update
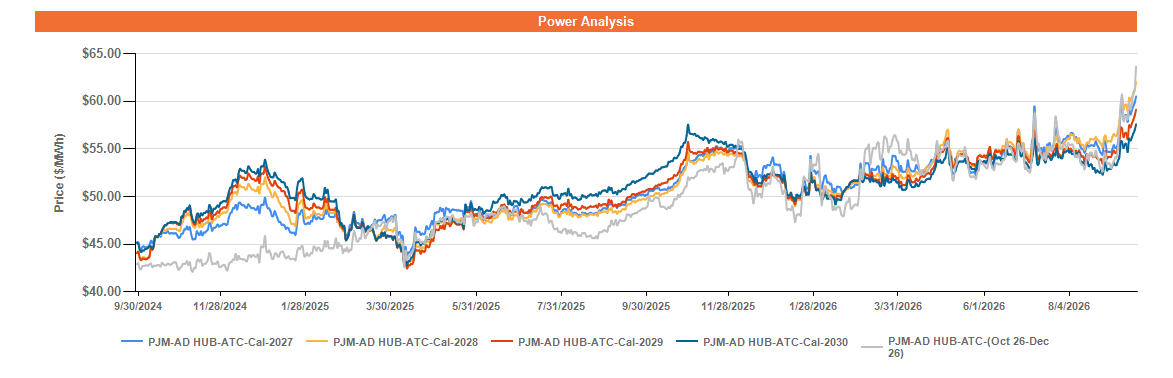
Figure 3 below shows the historical September 29, 2024 through September 29, 2026 ATC forward power prices in dollars per Megawatt hour (MWh) for the balance of 2026 (labeled as “Custom Strip”) and calendar years 2027, 2028, 2029, and 2030 for the AD Hub.
Figure 3: ATC Calendar Year Power Prices for the AD Hub
* Pricing courtesy of Direct Energy Business.
Forward power prices were already trading at or near multi-year highs before the Demand Response events on September 17 surprised the market. In the wake of those events and their impact on spot power prices, the risk premium in the forward power prices has increased even more, pushing the market to new all-time highs.
Perhaps even more than weather outlooks, market participants are paying exceptionally close attention to developments from PJM and state and federal regulators surrounding the unstable conditions on the grid, and what extraordinary solutions may be proposed or implemented in order to help stabilize conditions. It is likely that the forward and spot power markets will continue to remain volatile for the foreseeable future.